Interpreting VAERs: What is the expected background death rate for the USA vaccinated population?
- Jeffrey Morris

- Sep 25, 2021
- 7 min read
Updated: Oct 12, 2021
VAERs is an open reporting system put together by the FDA and CDC for people to enter in adverse events after vaccination for post approval safety assessments. It has limitations that prevent its use as a research data set to accurately assess numbers or rates of adverse events caused by vaccine. Three of its key limitations are:
It is an open reporting system, so we don't know what proportion of adverse events after vaccination are actually recorded (i.e. the reporting rate, or complement, the underreporting rate)
It is reporting adverse events following vaccination, including not only events caused by vaccines but also those that are coincident with vaccination but would have occurred even without vaccination. The frequency of such events is called the background event rate.
The lack of an unvaccinated control group in the data makes impossible to directly assess how many of the reported events are above and beyond background rates, or excess events, that could be caused by vaccination.
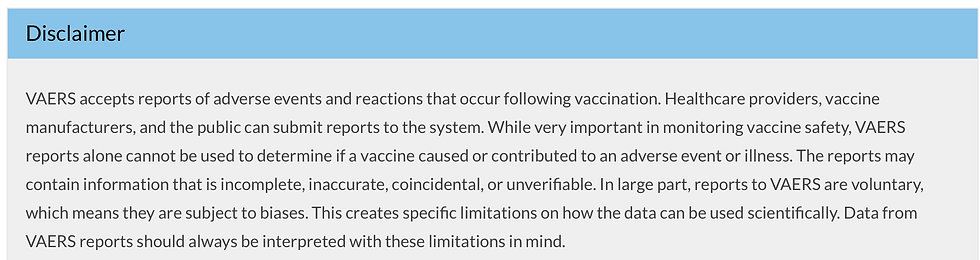
Because of these limitations and others, the VAERs website has a prominent disclaimer.
Its stated purpose is to detect "safety signals", hypotheses about specific adverse events that appear to be higher than expected in VAERs that should be further investigated and assessed. For example, they can be followed up in the active monitoring systems set up by the CDC and/or FDA, including CISA, VSD, and BEST, or can be investigated in population based studies made possible in countries with centralized medical records systems, e.g. in this NEJM paper comparing rates of myocarditis and other serious adverse events for vaccinated, unvaccinated, and SARS-CoV-2 infected in a matched case-control study spanning 1/2 the population of Israel. One major source of confusion about vaccine safety occurs when people ignore the background rate, and thus implicitly assume that all reported events in VAERs are causally related to the vaccine. It is important to understand this background rate and take it into account when interpreting VAERs data.
Even when using VAERs as intended to decide whether to flag an event as a potential "safety signal", one must assess whether the reported number of events is greater than expected based on the background rate of that event in the population sans vaccination and try to adjust for the (unknown) underreporting rate. In this blog post, I will not get into estimating the underreporting rate, but will focus on how to get a reasonable estimate of the background rate. Given deaths are the most serious potential adverse events, I will focus on assessing what is a reasonable estimate of the background rate of deaths for the vaccinated subpopulation in the USA.
Back of the Envelope Estimate of Background Death Rate As a back of the envelope calculation, in the USA roughly 3 million people die every year, which is ~250k per month, and ~50k per week. We can think of this as the overall background rate of deaths in the entire USA population. This suggests that even if vaccines were perfectly safe, if we vaccinated the entire population at a random time during the year, we would expect 250k to die within 1 month of vaccination, and 50k to die within a week of vaccination. However, this basic calculation does not account for the fact that not all in the USA have been vaccinated at this time, or that the vaccinated are not a randomly selected subset of the population. The vaccinated have a specific age distribution, with a higher proportion of the older population being vaccinated, an older population that has a much higher risk of death in a given year.
In this blog post, I will use available public resources to compute an improved estimate of the background rate of deaths in the USA vaccinated population.
The sources of data I will use in this calculation include:
Disclaimer: These are not necessarily the best, most recent or complete data sources to use for this exercise -- just the best I could find in the few hours I set aside to do this exercise. Given more detailed, better or updated data sets, this estimate could be considerably improved. At the end of this post I share my spreadsheet to document all of my calculations and I welcome anyone to take it an adapt the assumptions and/or data to get their own estimates.
However, I am confident these data are good enough to get a reasonable estimate that is the right order of magnitude that people can use in their assessment of whether vaccines appear to be causing excess deaths or not.
Estimating the Background Death Rate of USA Vaccinated Subpopulation
Following is an estimate of the USA population in millions split out by 5 year age groups as of July 1, 2020:

Next, I take the following estimates of death rates per 100k for various age groups from the CDC portal, computed using 2018 data.

I integrated this into the worksheet but just applying that death rate to the corresponding age groups and scaling up to rate per 1m, and then compute the actual number of expected deaths per year in each age group by multiplying this number by the population in millions.
Conservatively I assumed the 10-14yr group had the same death rate as 15-24yr. Since we are looking at the vaccinated population we don't need to consider death rates for children <12yr. Of course, it would be nice to have annual death rates in finer age groups, but this should suffice for our purposes.

The far right column gives the expected number of deaths in that age group in a year.
For our purposes, however, we want this number for the vaccinated subpopulation, not the entire population. So here we use the proportion of vaccinated with 1 or 2 doses from the CDC website, split out by age groups, here taking data through September 17, 2021:

So, next we will estimate the proportion of each age group in our primary worksheet that has received at least 1 dose of vaccination.
Since the age groups in the two data sets don't match up, we took a weighted average of the relevant vaccination rates. For example, for 15-19yrs, we took (1x52.7% + 2x60.5% + 2x62.3%)/5 = 59.7%. For the 10-14yr group, we only took 3/5 of the group since only the 12-14yr olds qualified for vaccination, not the 10-11 year olds.

The far right column gives us estimates of how many deaths to expect in a given year in the vaccinated subpopulation for each age group. This gives us an estimate of the background rate of death in this population, how many we would expect if vaccination were not increasing the amount of deaths. For perspective, it is useful to consider the background death rate per day, week, or month.

Thus, we expect that in the vaccinated subpopulation, we should see ~7k deaths per day and ~50k deaths per week. These numbers are very close to the "back of the envelope" estimates first presented, because the fact that not all are vaccinated is countered by the fact that the vast majority of those at high risk for death, the older people, are. To interpret in relation to vaccination, if vaccines were given at a random time, we would expect ~7k people to die the day of vaccination by random chance alone, even if the vaccines were perfectly safe and causing no deaths, >49k to die the week of vaccination, and >210k to die within a month of vaccination. These are the background rates of death for the vaccinated subpopulation of the USA.
It is important to take this into account when interpreting VAERs counts, since many of these background deaths would be reported to VAERs as post-vaccination events. In fact, according to law, healthcare workers would be required to report all of these events to VAERs whether they thought they might be related to vaccines or not. Thus, in principle, ALL of these deaths should be reported to VAERs.
Of course, whatever the law says, clearly not all deaths after vaccination are reported, so we still have to deal with the underreporting rate. Thus, to figure out the appropriate and relevant background rate against which to compare a particular number of VAERs-reported deaths to assess whether there is a safety signal, we would need to:
Pick a certain time frame after vaccination for which to compute background deaths
Assume a particular underreporting rate, possibly varying based on number of days post vaccination (since deaths closer to vaccination should be more likely to be reported, and deaths longer after vaccination less likely), and scale up the number of deaths based on the estimated underreporting rate.
If we really wanted to be more precise, for double vaccinated people, we would need to account for the time periods after each vaccine dose, so considering only first doses makes these numbers conservative. Also, these calculations do not take into account potential excess deaths from COVID-19 infections during the pandemic, so may be another reason why they are conservative.
The question of how to select a relevant time frame and estimate for the underreporting rate will not be addressed in this blog post, but suffice it to say that the assumptions of these two quantities will have a dramatic effect on one's assessment of the number of vaccine-induced excess deaths, or even if there are any.
This is one reason why scientists don't think VAERs can be used to obtain accurate estimates of vaccine-caused deaths -- while the calculations can be done, at the end of the day the answer will be strongly determined by the assumptions one makes in the relevant time frame and underreporting rate, as well as the background death rate.
So clearly, if one embarks on such an exercise, they should rigorously justify their assumptions on these key quantities and perform sensitivity analyses based on an appropriate level of uncertainty. Even then, they should consider their results as hypotheses to be tested with other data, using the active monitoring systems, population level data, or some other approach.
But, an essential component to any of these analyses is a relevant background event rate for the vaccination subpopulation, which is what I have tried to derive here. I hope the estimates and approach laid out here are useful for others in their investigation of whether they think there are "safety signals" of excess deaths in the VAERs data. Here is the Excel spreadsheet I used for my calculations, and I encourage anyone to download these and use them for their own analyses.


Compared with many browser racing games, Drive Mad focuses more on timing and balance than pure speed. That makes clearing difficult stages feel more rewarding instead of random.
The Real Pune Service I chose possessed a remarkable combination of charm, intellect, and beauty. From start to finish, the service was flawless, and I felt completely at ease the entire time.
best iptv : Welcome to Best IPTV 4K, your number one destination for premium-quality IPTV streaming. We bring you the future of television — thousands of live channels, movies, and series available in crystal-clear 4K Ultra HD. With lightning-fast servers, a smooth user interface, and zero-buffering performance, Best IPTV 4K ensures that your viewing experience is seamless and enjoyable every time.
Whether you’re a fan of live sports, movies, international channels, or entertainment shows, we’ve got you covered with a vast and diverse selection of content from all around the world. Our service is compatible with all major devices — including Smart TVs, Android boxes, Firestick, and mobile devices — making it easy to enjoy your favorite programs anytime, anywhere.
At…
crazy chicken 3d offers an exciting adventure where players control a brave chicken navigating through various challenges and collecting rewards in stunning 3D environments.
The Drive Mad physics engine adds a layer of realism, requiring players to carefully manage speed and balance to avoid crashes.